Financial Controls for Builders: Strengthening Governance
Strengthen your construction company with financial controls for builders. Learn governance best practices to prevent fraud and improve accountability.
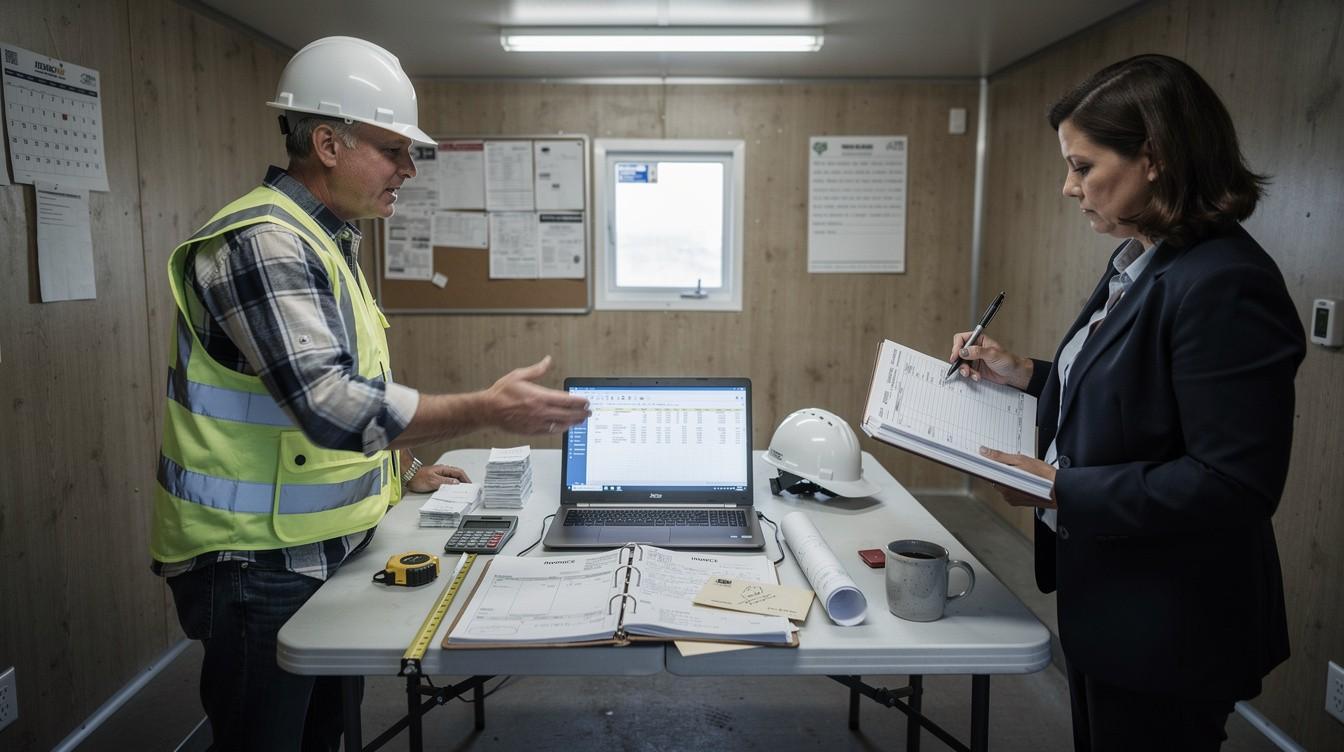
Most construction companies have no idea how much money walks out the door through labor inefficiencies. You track hours, you pay invoices, but you never see the real picture of where time actually goes on your jobs.
Labor productivity analytics changes that. At adding technology, we help contractors connect the dots between hours worked and dollars earned, revealing exactly where your crew performs well and where bottlenecks drain your profit margins.
Labor represents almost always the largest expense on a construction project, yet most contractors have almost no visibility into whether their crews actually produce results. You clock hours, process payroll, and move forward. What you don’t see is the gap between hours paid and value delivered. A crew that logs eight hours on a job might produce work equivalent to six hours, and you’ll never know the difference until the project runs over budget. This is where money leaks out of construction companies-not through dramatic failures, but through the slow drain of unmeasured inefficiency. When the U.S. construction industry productivity decline 8 percent from 2020 to 2022, it wasn’t because crews suddenly got lazy. It was because time tracking remained disconnected from actual output, and nobody had a system to spot where the gap widened.
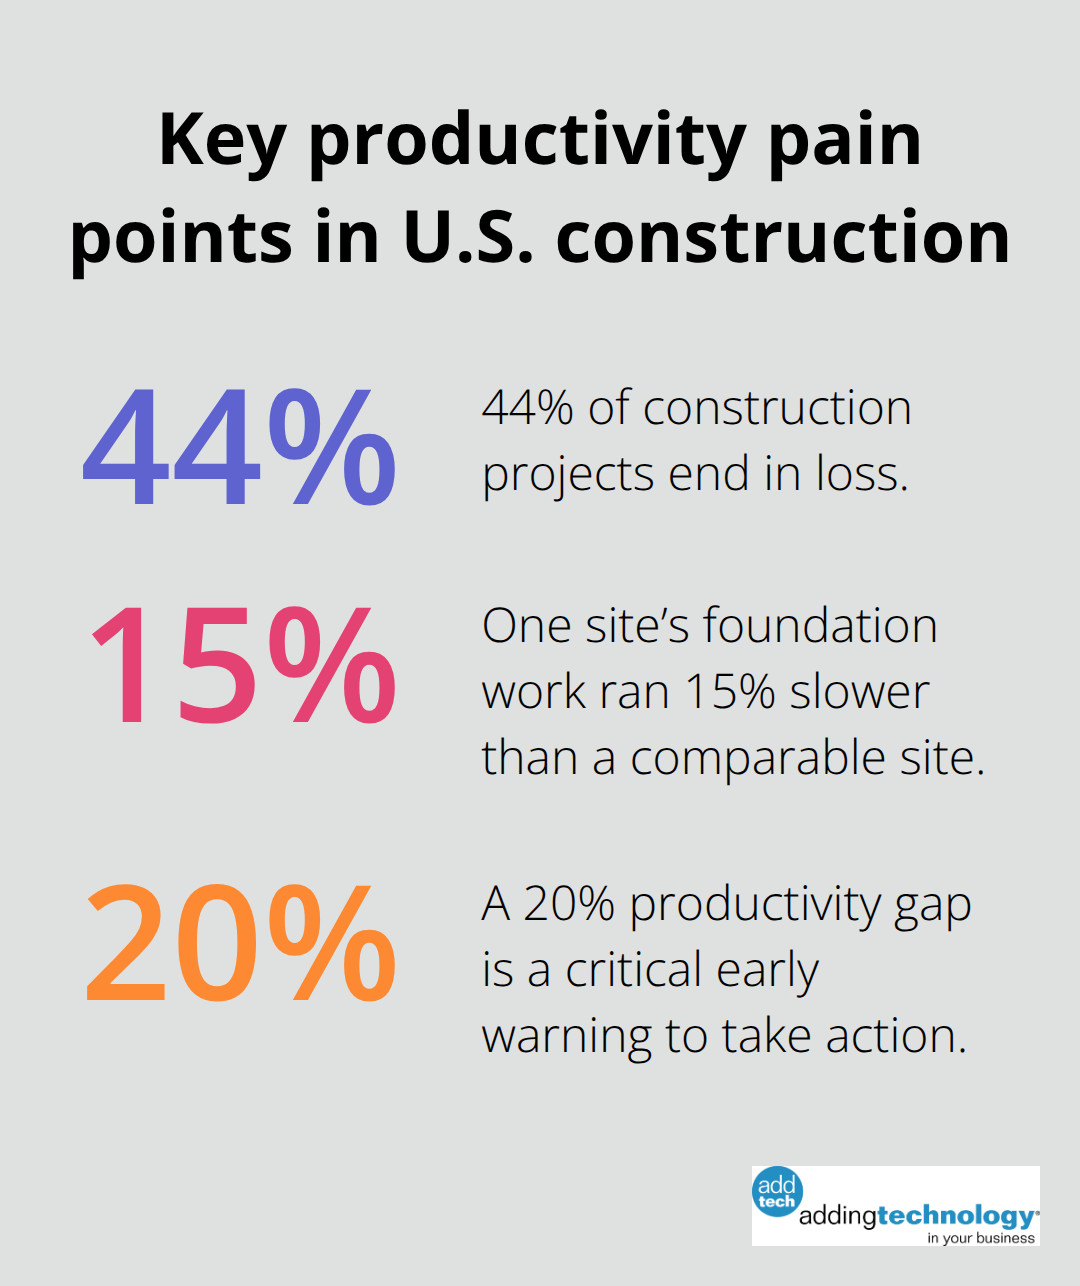
Payroll tells you what you spent on labor. It doesn’t tell you what you got in return. A project manager sees that Site A cost $15,000 in wages and Site B cost $15,000 in wages, and assumes the labor efficiency was similar. But if Site A completed 500 square feet of work and Site B completed 300 square feet, the true cost per unit differs dramatically. Payroll systems track compliance and tax obligations-they don’t track productivity. You need to know whether your crew produced 90 square feet per shift or 150 square feet per shift on similar work, because that difference compounds across every project and directly determines your margin. Time tracking gaps make this invisible. If your time data doesn’t connect to the specific tasks and phases on each job, you estimate productivity instead of measuring it. 44 percent of construction projects end in loss, and competitive pressure drives contractors to submit optimistic cost estimates rather than demand higher margins.
Better estimates come from knowing your actual productivity numbers, not from guessing.
Without labor productivity analytics, you can’t distinguish between a crew that struggles genuinely and one that performs well on a difficult job. You also can’t identify which team members, equipment, or processes slow things down. If productivity on a task drops 20 percent below your plan early in a project, you have time to investigate and adjust. If you don’t see it until the project reaches halfway completion, you’re locked in. A contractor who tracks labor hours against completed work spots underperforming shifts, teams, or equipment and reallocates resources before the entire job suffers. External benchmarking against industry standards amplifies this advantage. If your crew averages 45 square feet per worker-day on drywall finishing while the industry standard is 60, you have concrete evidence that training, supervision, or methods need improvement. That gap translates directly to bid accuracy and profit margin on future jobs.
The shift from payroll-only thinking to productivity analytics starts with one fundamental change: you must link every hour logged to the specific work completed. Mobile time tracking that captures clock-in and clock-out data on site, paired with job costing that assigns those hours to particular tasks and phases, creates the foundation. When your crew clocks in at 7 a.m. on the drywall phase of Building C, that time entry connects to the square footage or linear footage actually finished by day’s end. Real-time labor costing (which includes burden rates like insurance and benefits) then shows you the true cost per unit of work, not just the gross wage expense. This connection transforms payroll from a compliance document into a productivity tool. You stop asking “How much did we spend?” and start asking “How much did we produce for what we spent?”
Once you have accurate time-to-output data, patterns emerge. You notice that certain crews finish drywall at 90 square feet per shift while others hit 140. You see that Site A’s foundation work ran 15 percent slower than Site B, even though both used the same crew size. You discover that Tuesday shifts consistently underperform Monday shifts. These patterns reveal where training gaps, equipment issues, or scheduling problems exist. A contractor who monitors these metrics during a project-not after it ends-can adjust staffing, reallocate experienced workers to struggling teams, or investigate whether a particular tool or method is slowing production. Early detection of a 20 percent productivity gap gives you weeks to recover; late detection leaves you absorbing the loss. This is where labor productivity analytics stops being theoretical and becomes the difference between a profitable job and a money-losing one.
The next step is understanding how to actually implement this system without overwhelming your team or your budget.
The moment you connect time entries to completed work, everything changes. A crew that clocks in at 7 a.m. and out at 3:30 p.m. generates a data point-eight and a half hours-but that number means nothing until you know what those hours generated. If that crew finished 120 square feet of drywall, your cost per unit is roughly $9 per square foot (assuming a $108 daily rate). If another crew finished 180 square feet on the same day at the same cost, their efficiency is dramatically higher. This is what real-time visibility looks like: not just tracking hours, but immediately seeing the relationship between time spent and output delivered. When you measure productivity this way, patterns surface within days, not months. A contractor who runs daily time and output reports spots when a crew underperforms by 20 percent compared to plan and adjusts staffing or investigates the cause before the project hemorrhages money. You cannot improve what you do not measure.
Bottlenecks rarely announce themselves. A project manager might assume a foundation phase took longer because weather delayed the pour, when the real issue was that the concrete finishing crew averaged 35 square feet per worker-day instead of the planned 50. Without side-by-side productivity data, you blame external factors and miss the internal inefficiency. The fix starts with breaking work into discrete tasks and tracking labor hours against completed output for each one. If your crew spends 40 hours on a task that historically takes 30 hours, you have a problem. If that same task happens on three consecutive jobs at the same elevated hour count, you have a training issue, a method problem, or equipment that needs replacing. Real labor productivity analytics forces this specificity. You cannot hide behind project-level metrics anymore. Instead, task-level data reveals whether your drywall crews, concrete teams, or framing squads perform at expected rates. A crew that consistently finishes 20 percent slower than peers on the same work type signals a gap in skill, supervision, or process. Addressing that gap directly affects your bid accuracy on future jobs and your profit margin on current ones.
Payroll systems record wages; job costing systems connect those wages to specific work. When you assign labor hours to particular job phases and tasks, you create the bridge between time and dollars. Real-time labor costing adds burden rates-insurance, benefits, taxes, equipment-so you see the true cost of labor, not just the wage line item.
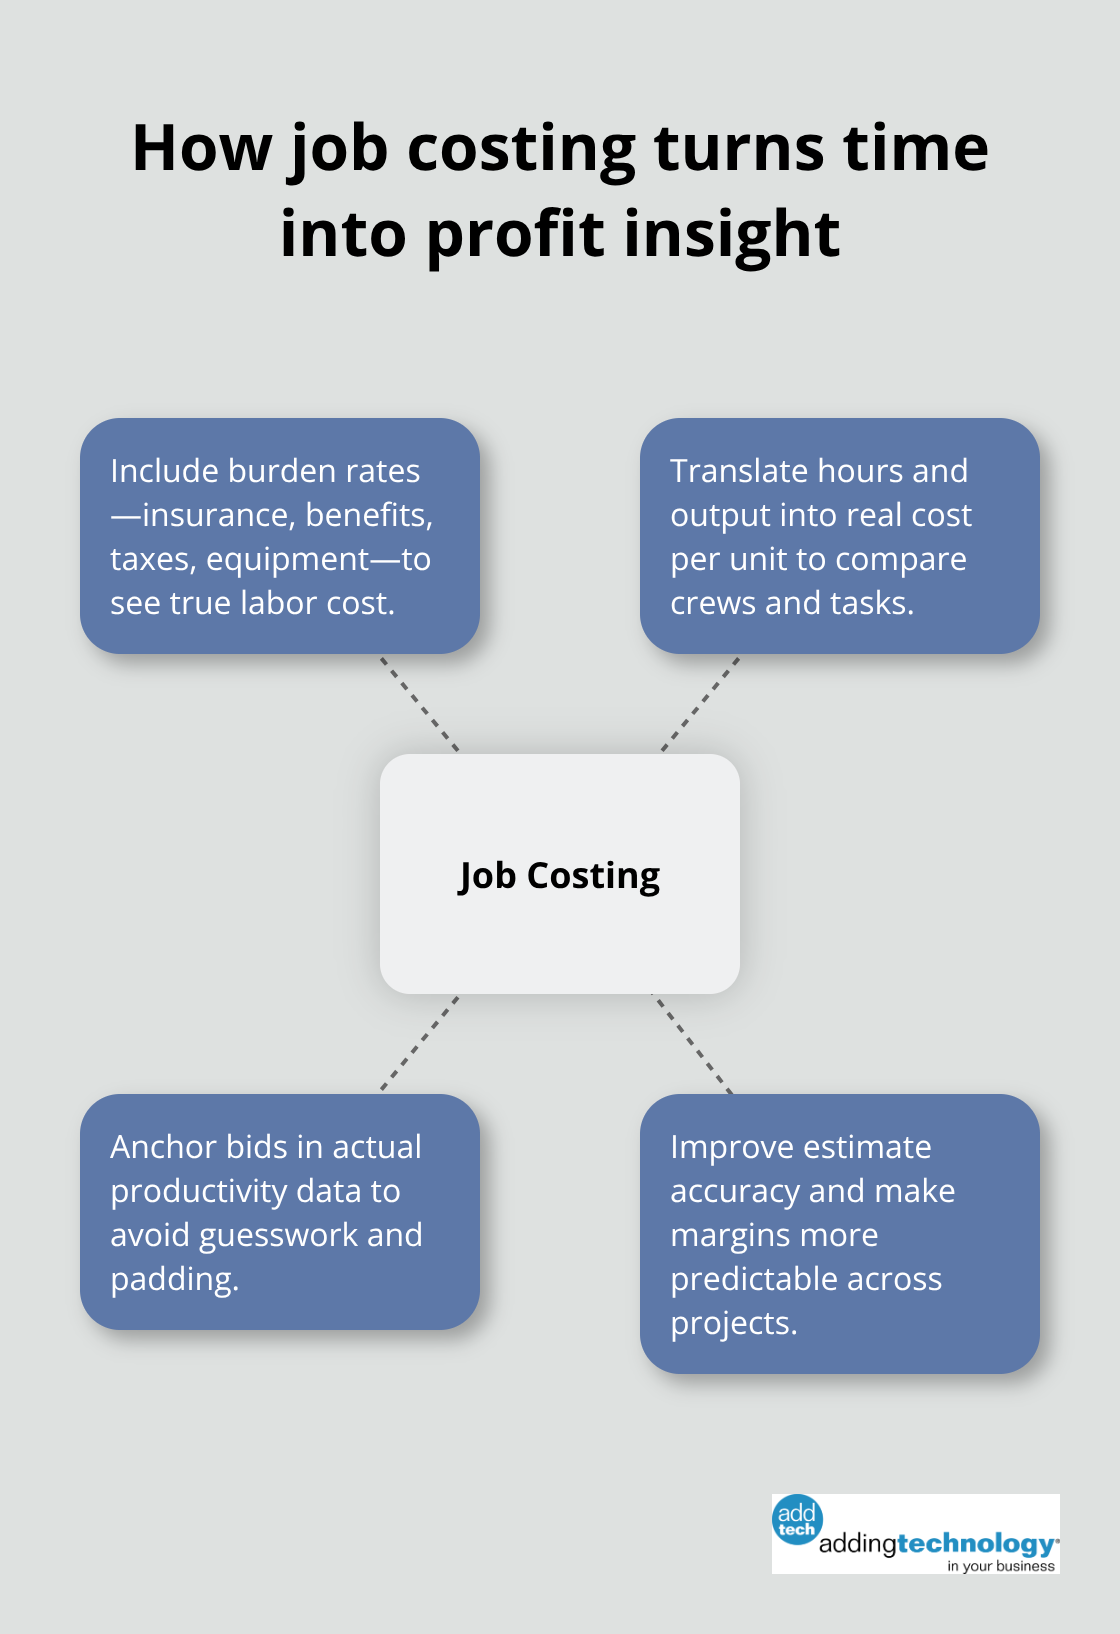
A crew member earning $25 per hour actually costs your company roughly $35 to $40 per hour once burden is included. If that crew member produces 50 square feet of finished work per eight-hour shift, your true cost per unit is $56 to $64, not $200. This clarity forces honest bidding. Contractors who estimate work without knowing their actual productivity numbers default to padding estimates or accepting aggressive bids and hoping margins materialize. Neither works consistently. Instead, use your historical productivity data to anchor estimates in reality. If you completed similar work at 45 square feet per worker-day on three recent projects, bidding that same work at 60 square feet per worker-day is wishful thinking. Your estimates become more accurate, your bids more competitive, and your profit margins more predictable when they rest on actual productivity numbers rather than guesses.
Once you have accurate time-to-output data, patterns emerge that reveal where money leaks. You notice that certain crews finish drywall at 90 square feet per shift while others hit 140. You see that Site A’s foundation work ran 15 percent slower than Site B, even though both used the same crew size. You discover that Tuesday shifts consistently underperform Monday shifts. These patterns expose training gaps, equipment issues, or scheduling problems that payroll alone never shows. A contractor who monitors these metrics during a project-not after it ends-can adjust staffing, reallocate experienced workers to struggling teams, or investigate whether a particular tool or method is slowing production. Early detection of a 20 percent productivity gap gives you weeks to recover; late detection leaves you absorbing the loss. This is where labor productivity analytics stops being theoretical and becomes the difference between a profitable job and a money-losing one.
The next step is understanding how to actually implement this system without overwhelming your team or your budget.
Three concrete moves launch labor productivity analytics: capture accurate time at the point of work, assign those hours to specific tasks, and use the data to make scheduling and staffing decisions. Most contractors fail not because the concept is hard to understand, but because they skip the first step or treat it as optional. Time tracking that happens in an office after the crew leaves the site is guesswork wrapped in a timestamp.
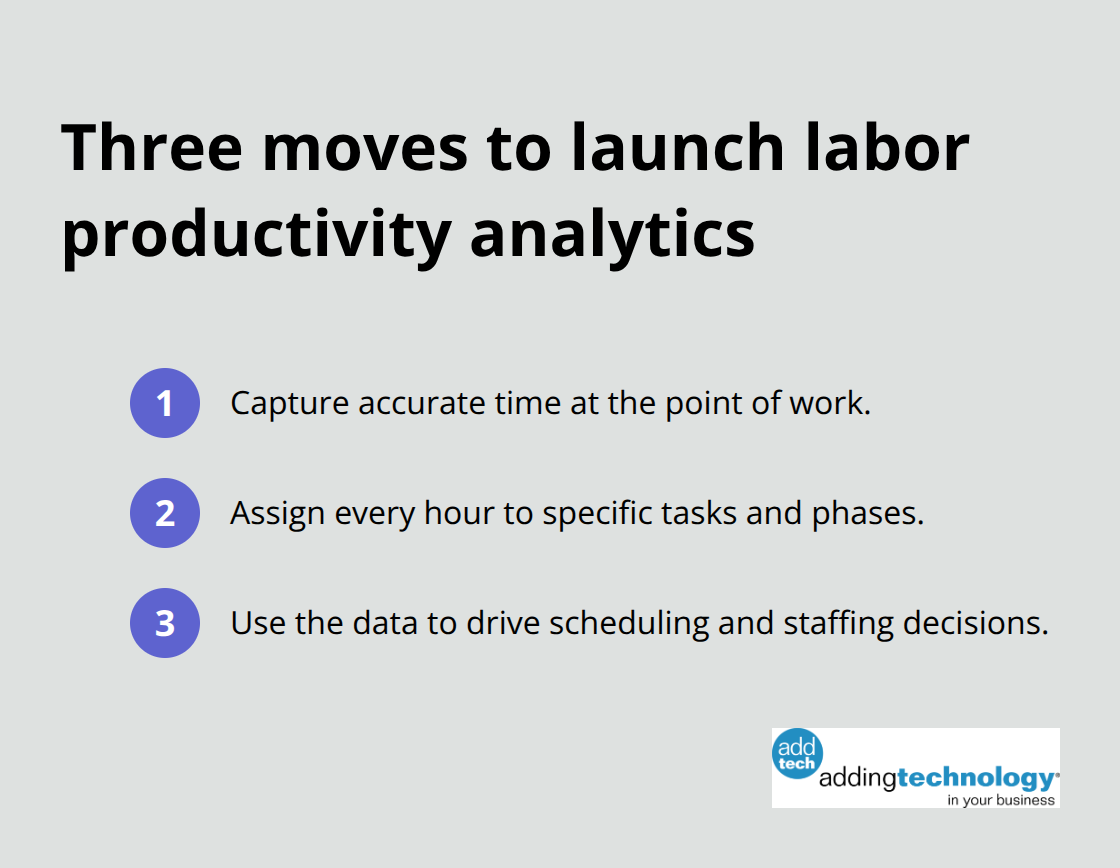
Mobile clock-in and clock-out on site, ideally with geofencing to confirm workers are actually present, gives you the foundation everything else rests on.
Geofencing deters buddy punching and creates accountability without invasive surveillance, capturing location data only at clock-in and clock-out rather than continuous tracking. Once you have reliable time entries, the next move is connecting those hours to the actual work completed. This means assigning labor to specific job phases and tasks, not lumping eight hours under a generic site code. A crew that clocks in at the foundation phase logs hours there; a different crew working drywall logs hours to drywall. This granularity is non-negotiable. Without it, you cannot calculate cost per unit of work or spot which tasks consistently underperform.
Real-time labor costing translates those hours into true cost by including burden rates like insurance and benefits. A $25-per-hour crew member actually costs $35 to $40 per hour once burden is factored in. That difference matters when you calculate whether a task ran at projected productivity or drifted over budget. Integration with payroll systems like QuickBooks Time or QuickBooks Payroll eliminates manual data entry and reduces errors, ensuring the hours you track feed directly into payroll without rework.
The data you collect only matters if you act on it. Set a routine for reviewing productivity metrics at the task level, ideally weekly during active projects. If a crew averages 45 square feet per worker-day on drywall when your bid assumed 60, you have discovered a gap that compounds across the entire project. Investigate whether the gap stems from underestimating the work difficulty, insufficient crew skill, or a method that needs adjustment. Early detection of a 20 percent productivity shortfall gives you time to reallocate experienced workers, add training, or adjust your approach before the entire project margin disappears.
Compare actual productivity against your historical baseline and against industry standards to build credibility around your findings. Know your own numbers first, then use external benchmarks to validate whether gaps are normal or problematic. If you consistently finish similar work at 45 square feet per worker-day across multiple projects, that is your real productivity rate, not the 60 you optimistically estimated years ago. Bids grounded in actual performance are more competitive because they reflect reality rather than hope, and your margins become predictable instead of a surprise at project close.
Labor productivity analytics separates contractors who operate on facts from those who operate on assumptions. Every dollar that walks out the door through unmeasured inefficiency never reaches your bottom line, and a crew that finishes 45 square feet per worker-day instead of the 60 you estimated costs you real money on every single project. That gap compounds across your portfolio and directly determines whether you build margin or absorb loss.
The contractors winning right now measure productivity, spot patterns early, and adjust before problems become disasters. They know their actual labor costs per unit of work, bid based on historical performance rather than hope, and catch a 20 percent productivity shortfall in week two instead of week eight. This data-driven approach delivers visibility, accuracy, and control that transforms how you see labor costs and project profitability.
Start with accurate time capture on site, connect those hours to specific tasks, and review the data weekly. Let patterns emerge, benchmark against your own historical performance first, then against industry standards, and use what you learn to adjust staffing and methods on active projects. We at adding technology help contractors build the financial foundation that makes this possible through real-time job costing and streamlined accounting systems that transform labor visibility into smarter decisions.


At adding technology, we know you want to focus on what you do best as a contractor. In order to do that, you need a proactive back office crew who has financial expertise in your industry.
The problem is that managing and understanding key financial compliance details for your business is a distraction when you want to spend your time focused on building your business (and our collective future).
We understand that there is an art to what contractors do, and financial worries can disrupt the creative process and quality of work. We know that many contractors struggle with messy books, lack of realtime financial visibility, and the stress of compliance issues. These challenges can lead to frustration, overwhelm, and fear that distracts from their core business.
That's where we come in. We're not just accountants; we're part of your crew. We renovate your books, implement cutting-edge technology, and provide you with the real-time job costing and financial insights you need to make informed decisions. Our services are designed to give you peace of mind, allowing you to focus on what you do best - creating and building.
Here’s how we do it:
Schedule a conversation today, and in the meantime, download the Contractor’s Blueprint for Financial Success: A Step by-Step Guide to Maximizing Profits in Construction.” So you can stop worrying about accounting, technology, and compliance details and be free to hammer out success in the field.