
Compliance Training for Contractors: Staying Ahead of Regulations
Master compliance training for contractors with essential regulations and best practices to protect your business and team.
Most contractors run projects without seeing the real numbers until it’s too late. By then, a job that looked profitable on paper has already eaten into your margins.
At adding technology, we’ve seen how the right financial reports transform bid profitability optimization from guesswork into strategy. Three core reports-job costing, cash flow statements, and profit and loss statements-give you the visibility you need to catch problems early and make smarter decisions.
Job costing reports reveal whether your bid was profitable or whether the project already ate into your margins. These reports track every dollar spent on a project-materials, labor, equipment, subcontractors-and compare it against what you estimated. The gap between estimate and reality shows you where you underpriced work or lost cost control. Real-time expense tracking through job costing helps you catch cost overruns before they spiral. Job costing isn’t optional; it separates a healthy business from one that survives on volume alone. You need to know how much a project actually costs, not what you hoped it would cost when you bid it.
Direct costs are the expenses tied to a specific job: materials you ordered for that kitchen remodel, the crew hours on that commercial build, the equipment rental for the excavation phase, the subcontractor invoice for electrical work. Indirect costs-your office staff, insurance, vehicle maintenance, training-get allocated across all your projects. This distinction tells you whether a job is truly profitable or just covering overhead. A project that shows strong revenue but high direct cost overruns kills profitability. When you run a job cost report, break out labor, materials, equipment, and subcontractors separately. This granularity lets you spot where waste happens. If material costs on your last five kitchen jobs exceeded the bid by an average of 8 percent, you have a pricing or procurement problem to fix before the next bid.
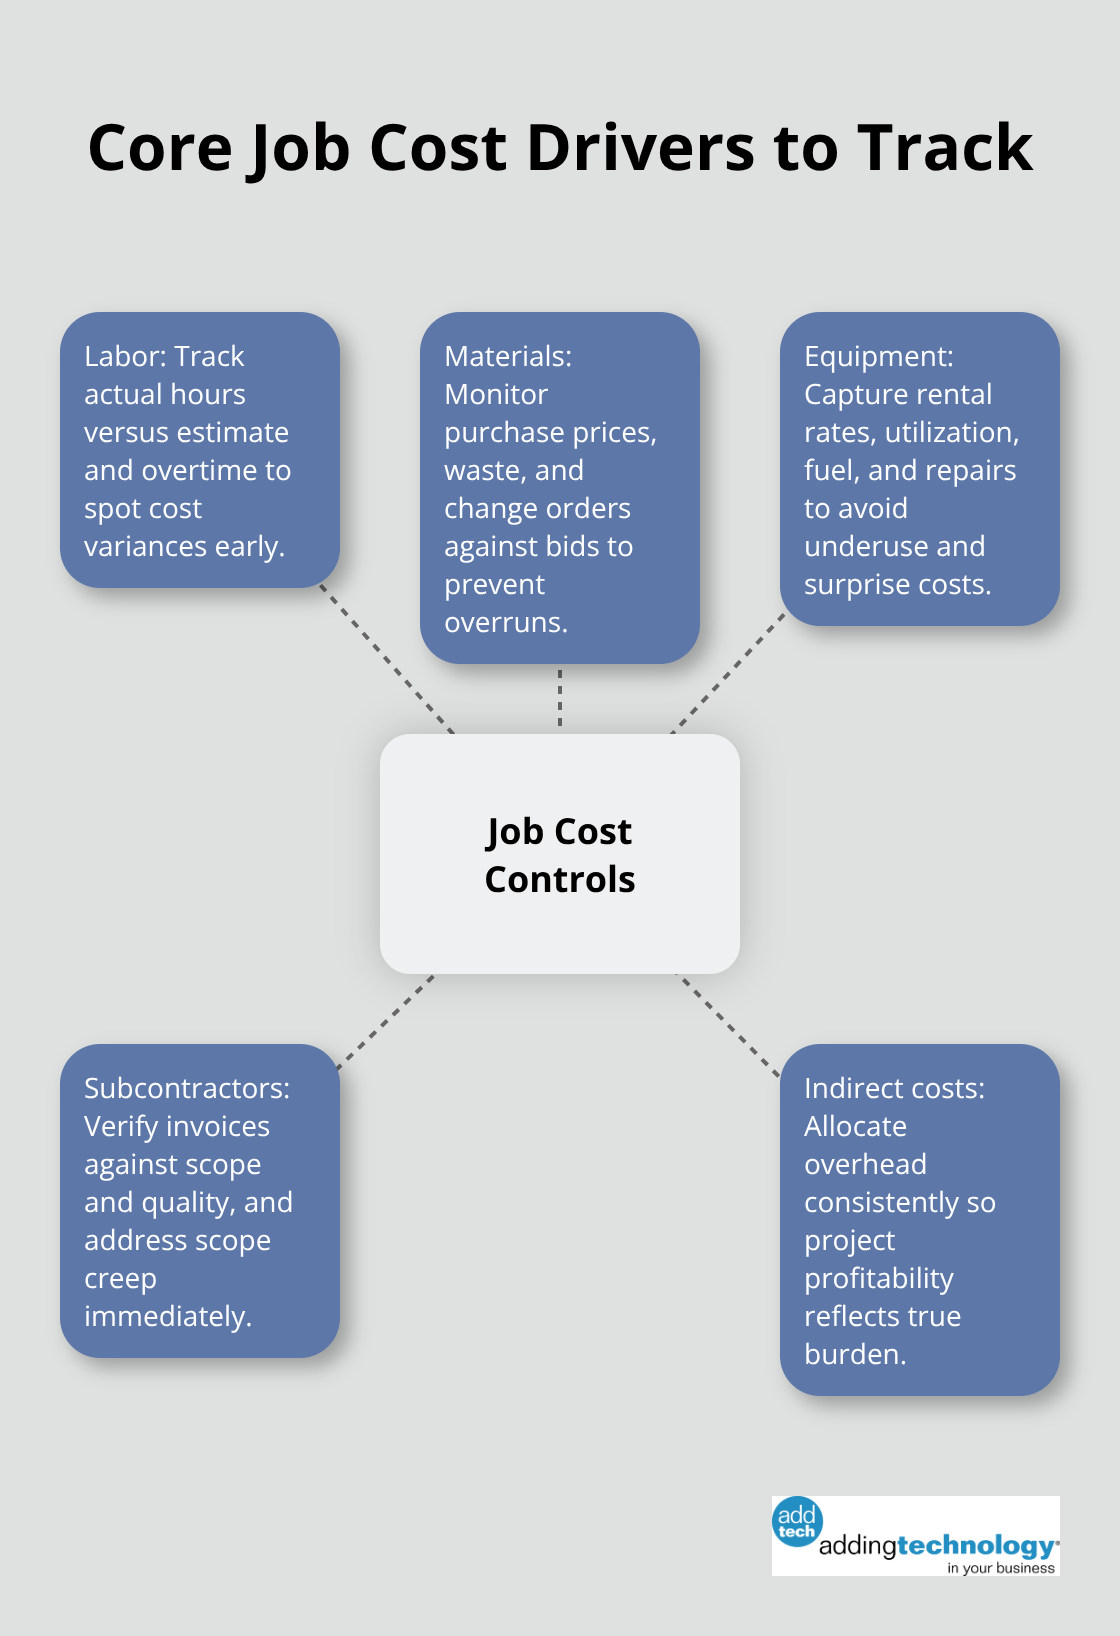
Unit productivity reports show how much output your crew completes per hour. If crew productivity drops 15 percent from your historical average, that signals overtime, inefficiency, or scheduling problems showing up in real time, not at the end of the project. Labor cost reports break down actual versus estimated labor costs, hours, and overtime per job. This data reveals whether your crew estimates are realistic or whether you consistently underestimate how long work takes. Equipment costs deserve close attention because underutilization and unexpected repairs spiral fast. Subcontractor costs need verification against scope and quality; if a sub runs over budget, clarify scope immediately or adjust the project plan.
Set a review cadence and stick to it. Weekly or biweekly job cost reviews catch variances while there’s still time to act. Compare actual costs against your budget at each project phase and flag jobs where the percentage of work completed lags behind the percentage of budget spent. If you’re 40 percent complete but have already spent 55 percent of your labor budget, you have a problem. Material costs reveal procurement inefficiencies, waste, or specification mismatches. Monitor schedule performance too, because delays directly inflate costs. Scope creep kills profitability silently-document every change order and track its cost impact. When you identify a variance, investigate the root cause with your project team and implement corrective action right away.
Construction accounting software automates data capture and produces these reports efficiently, removing manual errors and delays that let problems hide. Real-time job costing gives you visibility into project performance as work happens, not weeks later when the damage is already done.
Job costing reports answer one critical question: Is this project making money? Once you know the answer, you need to understand your cash position-whether you actually have the money to pay your crews and suppliers while waiting for client payments.
A profitable job on paper means nothing if you can’t pay your crew next Friday. Cash flow is the heartbeat of construction, and most contractors ignore it until cash runs dry. Job costing tells you whether a project makes money. Cash flow statements tell you when that money actually arrives in your account and when you need to pay bills. These are not the same thing. A contractor billing $500,000 on a project can still face a cash crisis if the client doesn’t pay for 60 days while you’ve already paid your subs and suppliers. Construction has brutal cash dynamics: you spend money upfront on materials and labor, wait weeks or months for client payment, and manage retainage that gets held back until final completion. A cash flow statement tracks cash in, cash out, and the timing gap between them. Without this visibility, you’re flying blind.
Most contractors struggle with seasonal swings. Winter months might bring zero revenue while overhead continues. Summer projects ramp up revenue fast, but materials get ordered and crews hired before invoices go out. Days in Accounts Receivable and Days in Accounts Payable measure how long cash sits outside your bank account. If your average customer takes 45 days to pay but you pay subs in 15 days, you’re financing their work with your cash reserves. That gap compounds across multiple projects. Tightening payment terms with customers or negotiating longer payment windows with suppliers directly improves liquidity.
Retainage compounds the problem further. On a $500,000 project, retainage at 5 percent ties up $25,000 until final closeout, sometimes 30 to 60 days after substantial completion. Track retainage separately and forecast when it releases. Working capital-the difference between current assets and current liabilities-tells you whether you have enough liquid resources to fund ongoing operations. Construction firms typically need 30 to 45 days of operating expenses in working capital to survive project cycles and payment delays. Monitor this number monthly. When working capital drops below your threshold, it signals that you need financing or must slow project starts.
Cash flow projections matter more than historical cash flow. Project forward 12 weeks based on your backlog, known payment schedules, and payroll timing. If a large project completes in week 8, retainage releases in week 12, and you have payroll due in week 9, you have a short-term cash gap that requires planning. Many contractors use lines of credit to bridge these gaps, but that costs money in interest and fees. Better planning prevents the gap entirely.
Accounts Receivable aging reports show exactly which invoices remain unpaid and how old they are. Invoices over 30 days old demand immediate follow-up. Invoices over 60 days old need escalation.
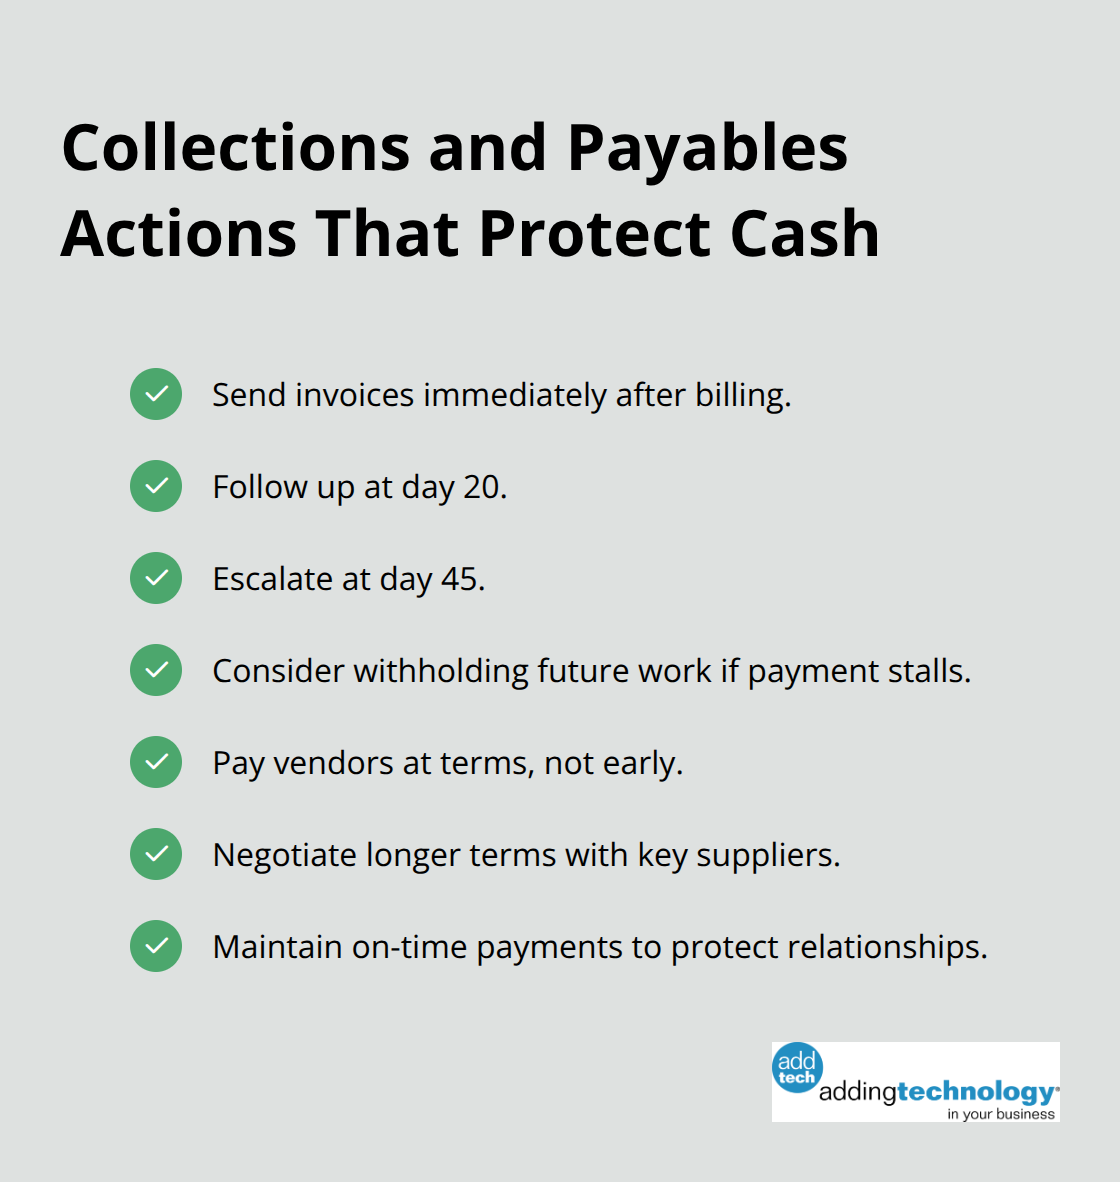
Construction contracts often include payment terms of Net 30 or Net 45, but many clients ignore these. Implement a collection process: send invoices immediately after billing, follow up at day 20, escalate at day 45, and consider withholding future work if payment doesn’t materialize. Accounts Payable aging works the opposite direction. Paying all bills immediately depletes cash. Paying at terms (typically Net 30) optimizes cash flow. Negotiate extended terms with key suppliers if possible, but maintain relationships by paying on time consistently. The goal is to create a cash float where you hold client money longer than you hold supplier obligations, improving your liquidity position without damaging relationships.
Understanding your cash position protects your business from the inside. But protecting your profitability requires a broader view-one that compares your total revenue against all your expenses, not just project costs.
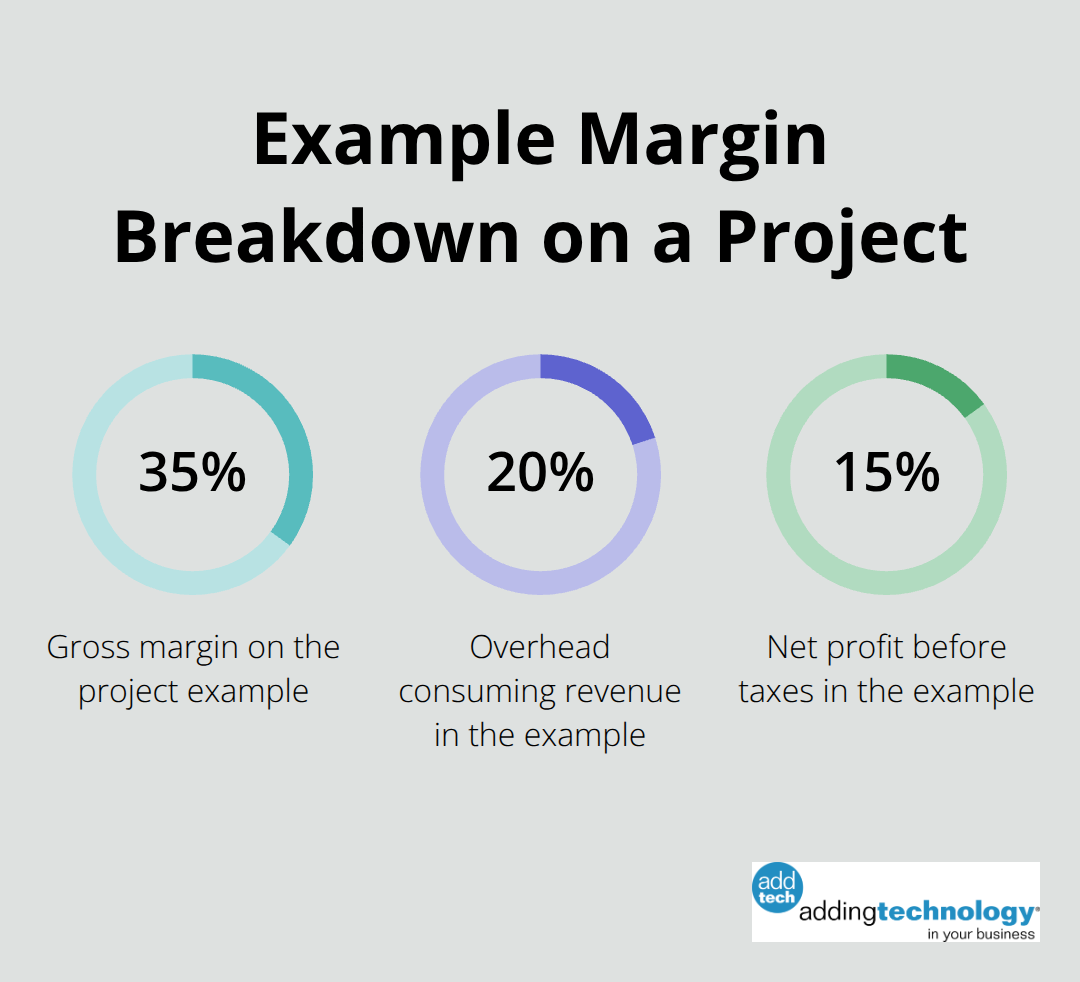
Your profit and loss statement answers the question job costing and cash flow cannot: Is your business actually profitable after all expenses are paid? Job costing shows you project profitability. Cash flow shows you timing. Your P&L shows the complete financial reality. It compares every dollar of revenue against every dollar of expense-direct costs, indirect overhead, operating expenses, interest, and taxes. Most contractors focus obsessively on project margins and ignore the overhead that consumes those margins. A project with a 35 percent gross margin looks excellent until you realize your office staff, insurance, vehicle maintenance, and administrative costs consume 20 percent of revenue. That leaves only 15 percent net profit-and that’s before taxes. The construction industry averages a 26 percent gross profit margin with healthy margins in the 25 to 35 percent range, but net profit margins typically fall to 3 to 7 percent.
That gap between gross and net represents overhead. Understanding this gap forces you to make hard decisions about pricing, overhead control, and project selection.
Gross margin measures revenue minus direct costs-materials, labor, equipment, subcontractors-and shows what remains to cover overhead and profit. If your gross margin sits at 20 percent when industry standards suggest 26 percent, you have a pricing or productivity problem. Calculate gross margin separately for each project type. Remodel margins might be 28 percent while new construction runs 24 percent. This breakdown tells you which project types actually pay your bills and which ones subsidize others. Track gross margin trends monthly. If margins slip from 26 percent to 23 percent over six months, investigate immediately. The culprits are usually underestimation, material cost inflation outpacing your pricing, labor productivity decline, or scope creep. One contractor discovered their kitchen remodel estimates assumed 40 labor hours but actual jobs consumed 52 hours consistently. They raised their estimate to 48 hours, added pricing to reflect that reality, and gross margin on remodels recovered from 22 percent to 27 percent within two quarters. The fix required discipline but changed the business. Compare your actual gross margin against your bid estimate for every completed project. If you estimated 32 percent margin but delivered 24 percent, something failed in execution or estimation. Document these variances. Over time, patterns emerge that improve future bidding accuracy.
Operating expenses-office salaries, insurance, bonding, marketing, professional services, vehicle costs, training-typically consume 15 to 20 percent of revenue for most contractors. These costs remain relatively fixed regardless of project volume, creating a profitability challenge when revenue fluctuates. A contractor with 18 percent overhead operating at 90 percent capacity still carries 18 percent overhead. Revenue drops but overhead stays. This reality forces contractors to maintain consistent project flow or face margin compression. Separate selling costs from general and administrative costs. Selling costs include marketing and business development. G&A covers office staff, accounting, human resources, and facilities. Some contractors spend 3 percent of revenue on sales while others spend 8 percent. Knowing your spending reveals whether you invest aggressively in growth or run lean. Operating profit margin-revenue minus direct costs and operating expenses-shows profitability before interest and taxes. This number matters to lenders and bonding companies evaluating your creditworthiness. Net profit margin-what remains after interest, taxes, and depreciation-represents what you actually keep. A contractor with 28 percent gross margin, 18 percent overhead, and 8 percent interest and tax burden ends with 2 percent net profit. That’s thin. Most construction firms target net margins of 5 to 10 percent. If you’re below 3 percent, your business model struggles.
Review your P&L monthly, not quarterly. Monthly review catches expense creep before it destroys margins. Compare current month to last month and year-to-date to budget. Flag variances over 5 percent for investigation. If marketing costs jumped 40 percent, you need to know why and whether results justify the spend. Depreciation and amortization reduce taxable income but don’t affect cash, so track them separately in your analysis. EBITDA (earnings before interest, taxes, depreciation, and amortization) serves as a core profitability metric for contracting firms because it isolates operating performance from financing and accounting decisions. Use EBITDA alongside net profit to understand your true operational efficiency.
Three financial reports form the foundation of construction profitability: job costing reveals project-level performance, cash flow statements expose timing gaps that kill liquidity, and profit and loss statements show whether your business survives after all expenses are paid. Job costing informs bid profitability optimization, cash flow projections prevent liquidity crises, and P&L analysis reveals whether your pricing and overhead structure actually support your target profit. Together, they answer the questions that matter most: Is this project making money? Do I have cash to pay my crew? Is my business actually profitable?
Track these metrics monthly without exception, because quarterly or annual reviews arrive too late for corrective action. Gross profit margin by project type tells you which work actually pays, operating expense ratio shows whether overhead consumes your margins, and Days in Accounts Receivable and Days in Accounts Payable measure how efficiently cash moves through your business. Construction accounting software that integrates job costing with financial reporting eliminates manual delays and removes errors that hide problems, delivering real-time visibility into profitability and cash position.
Start now with one metric if you must. Adding Technology offers expert accounting and financial management services tailored for the construction industry, helping you build systems that support growth without the burden of financial management. Track gross margin on your next five projects, monitor cash flow for the next 12 weeks, or review your P&L against budget this month-small steps compound into financial clarity that transforms how you run your business.


At adding technology, we know you want to focus on what you do best as a contractor. In order to do that, you need a proactive back office crew who has financial expertise in your industry.
The problem is that managing and understanding key financial compliance details for your business is a distraction when you want to spend your time focused on building your business (and our collective future).
We understand that there is an art to what contractors do, and financial worries can disrupt the creative process and quality of work. We know that many contractors struggle with messy books, lack of realtime financial visibility, and the stress of compliance issues. These challenges can lead to frustration, overwhelm, and fear that distracts from their core business.
That's where we come in. We're not just accountants; we're part of your crew. We renovate your books, implement cutting-edge technology, and provide you with the real-time job costing and financial insights you need to make informed decisions. Our services are designed to give you peace of mind, allowing you to focus on what you do best - creating and building.
Here’s how we do it:
Schedule a conversation today, and in the meantime, download the Contractor’s Blueprint for Financial Success: A Step by-Step Guide to Maximizing Profits in Construction.” So you can stop worrying about accounting, technology, and compliance details and be free to hammer out success in the field.